The Central Bank of Turkey (CBRT) has published new research note on its blog, offering an in-depth evaluation of Turkey’s economic activity during the second quarter, based on the latest GDP data.
In the second quarter of 2024, the services sector remained the primary driver of Turkey’s annual GDP growth, with a 3.1% increase, despite a quarter-on-quarter decline. However, the industrial sector had a negative impact on growth, contributing a 0.4-percentage point reduction. The quarter saw a 3.9% contraction in industrial production, influenced by the calendar effects of religious holidays combined with weekends, which led to additional bridge days.
The analysis highlights that bridge days can cause significant volatility in industrial production, with estimates showing a monthly decrease of about 1.3% due to these days. This volatility could have reduced quarterly GDP growth by 0.15 to 0.45 percentage points. However, this negative effect may result in an upward correction in industrial production and GDP data in the third quarter.
Overall, the first half of 2024 indicates a moderate but increasing decline in economic activity due to the delayed effects of monetary policy. High-frequency data for the third quarter also suggest a continued slowdown in domestic demand, which is expected to further support the disinflation process.
The composition of growth stands out as an important factor both for sustainability of growth and the disinflation process. In the post-pandemic period, particularly, the growth rates were relatively high and mostly driven by domestic demand. According to the Gross Domestic Product (GDP) figures announced by TURKSTAT for the second quarter of 2024, national income in constant prices increased by 0.1% quarter-on-quarter, and by 2.5% year-on-year basis. Based on revised data, in the first quarter of the year, these ratios were 1.4% and 5.3%, respectively. Thus, national income increased by 3.8% on an annual basis in the first half of the year. The data reveal that, in the second quarter, economic activity lost pace in line with the disinflation process. In this blog post, we analyze the underlying trend of economic activity in the first half of the year in terms of expenditures and production, based on national income data.
Expenditure Developments
In the first quarter of the year, the largest contribution to growth came from final domestic demand. This contribution was mainly driven by the rise in private consumption accompanied by wage hikes, additional campaigns by firms, and brought-forward demand.[1] In the second quarter of the year, we observe a significant slowdown in final domestic demand as the lagged effects of monetary tightening kicked in. Actually, in this quarter, the contribution of domestic demand to annual growth declined to 1.2 percentage points when inventories are taken into account, while net exports also made a positive contribution to annual growth amid favorable performance of external balance (Chart 1). Accordingly, we assess that growth components point to a gradual rebalancing in demand outlook in the first half of the year.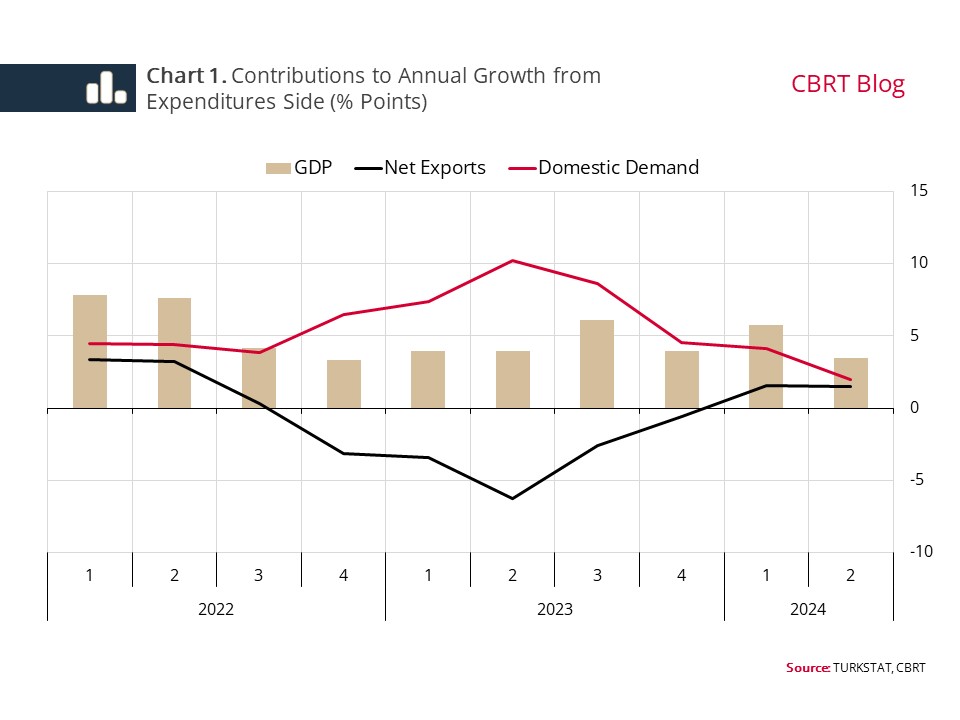
Production Developments
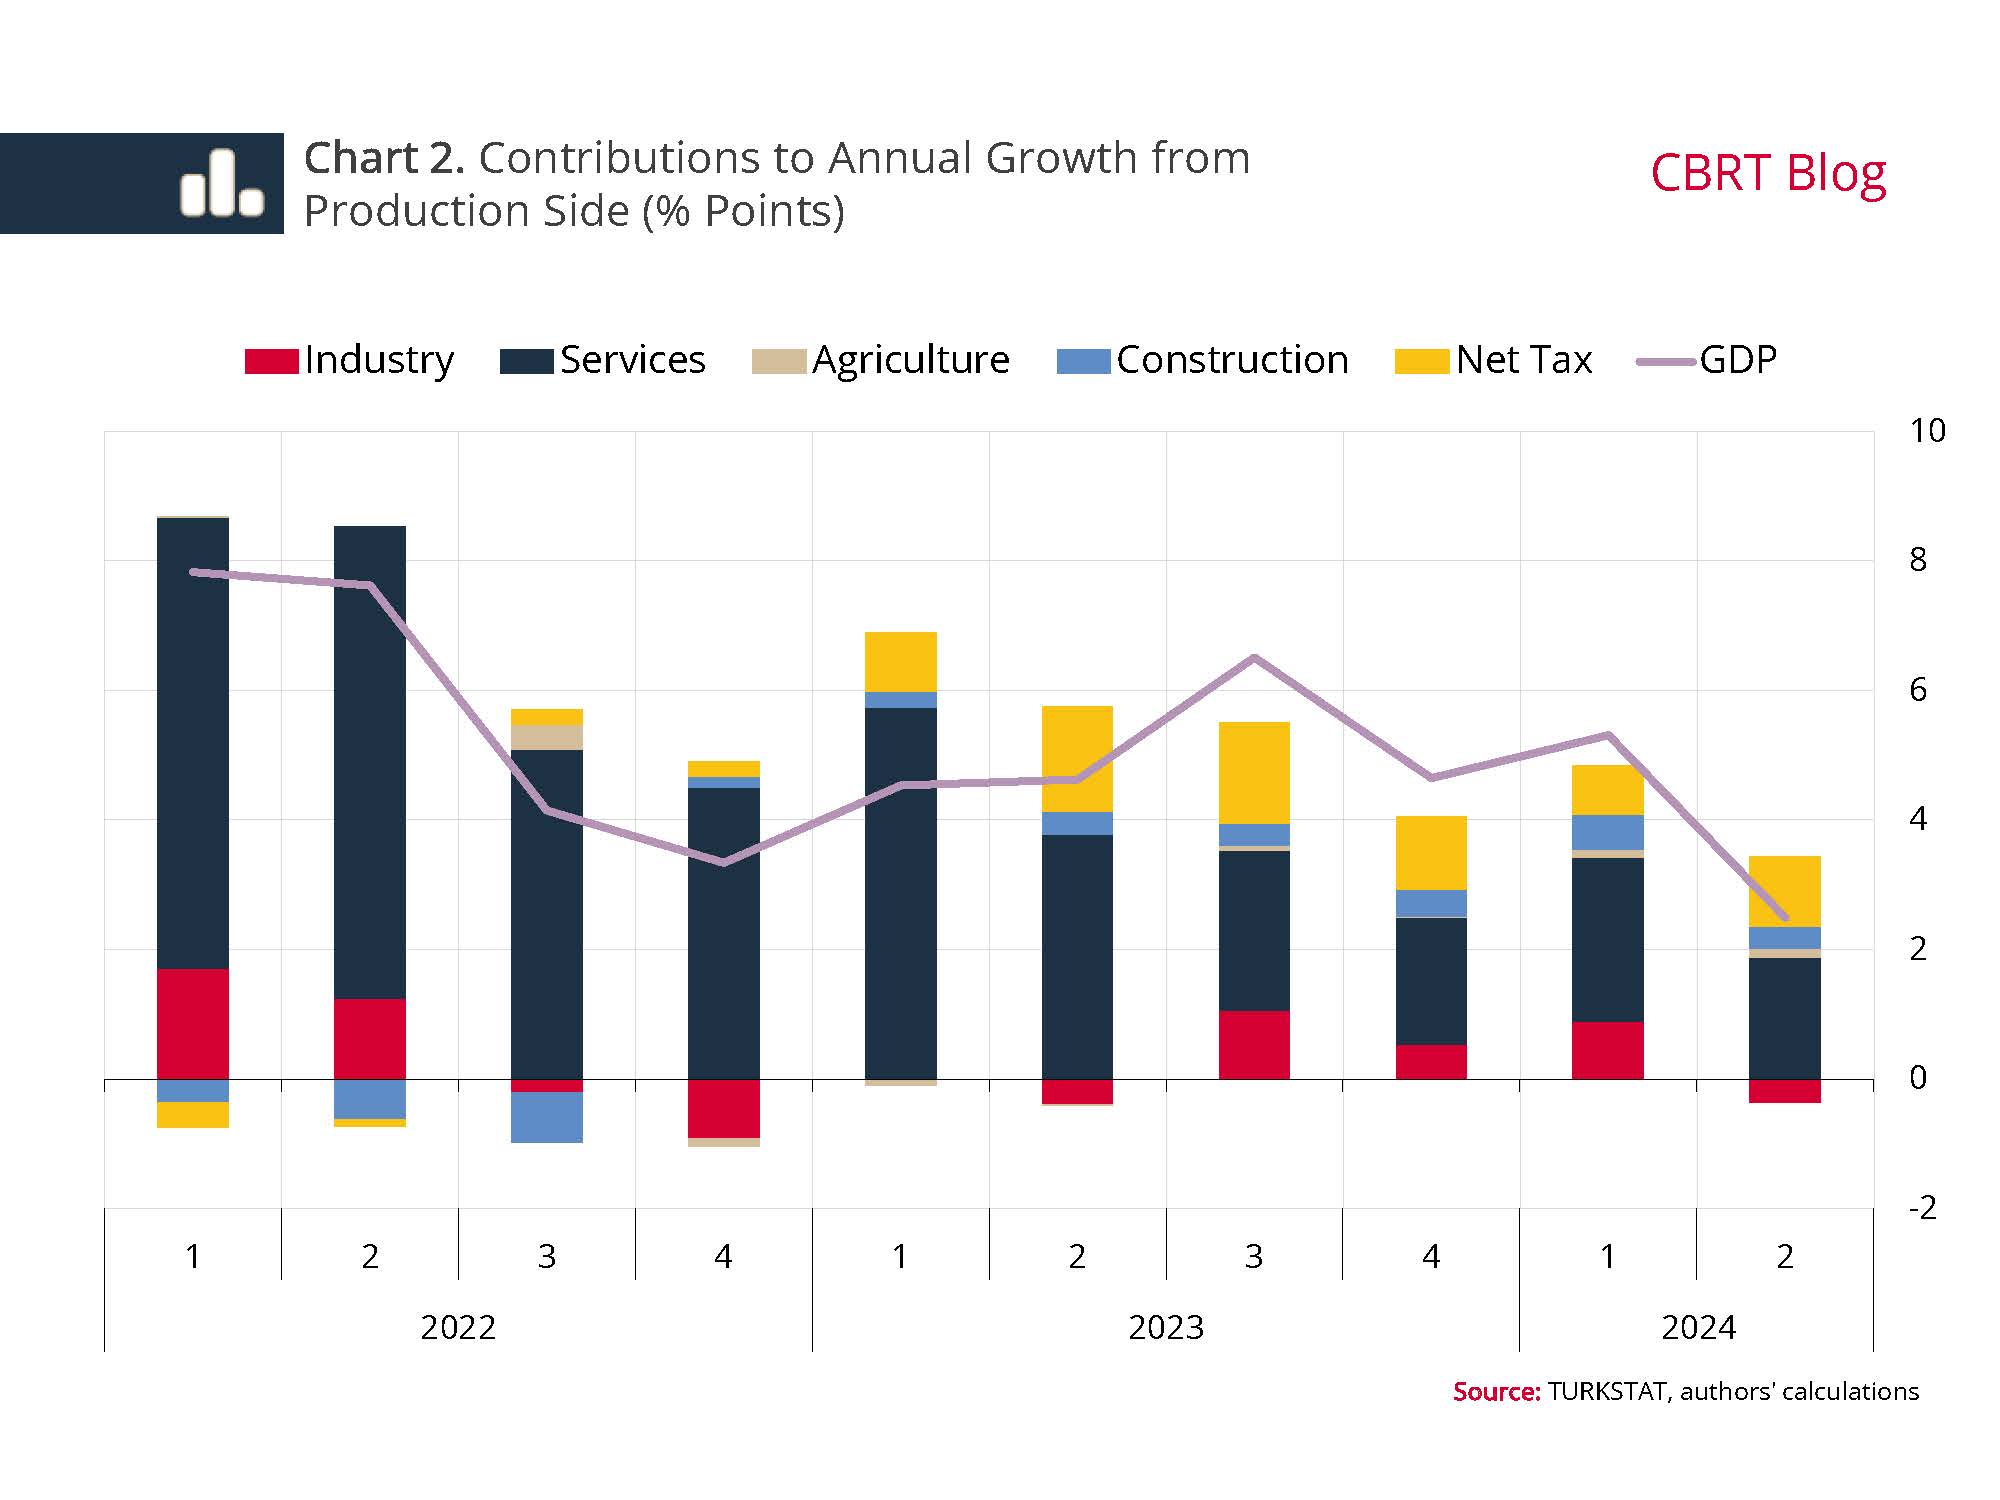
An analysis of GDP data in terms of production reveals that the services sector was the main driver of annual growth in the second quarter, as in the first quarter (Chart 2). In this quarter, the services sector grew by 3.1% on an annual basis and despite a quarter-on-quarter decline, the contribution of the services sector to annual growth remains high. Meanwhile, the contribution of industrial value added to annual growth turned negative in the second quarter, making a 0.4-percentage point downward effect. Quarter-on-quarter, the contribution of industrial production to GDP decreased and remained flat at 0.1%.[2] While assessing this weak outlook in industrial production, the calendar effects of the period shall also be taken into account. Actually, this year, both religious holidays were in the second quarter, and both holidays were combined with the weekends, creating an additional calendar effect of bridge days.
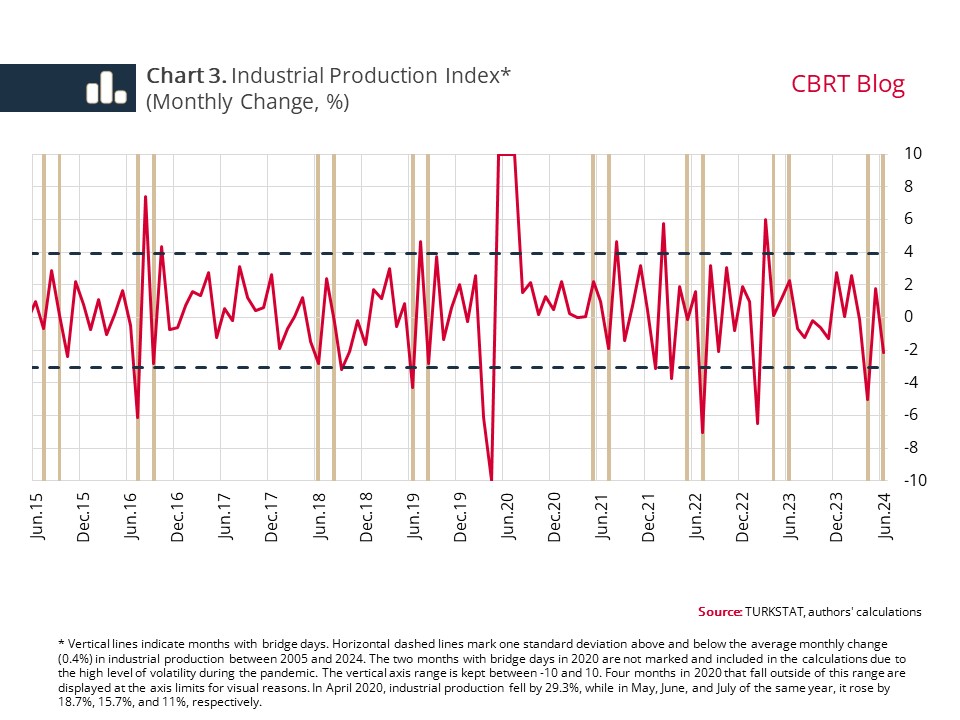
It should be noted that, seasonally and calendar-adjusted data take into account missing working days due to religious holidays in the relevant months, but they do not account for working day losses associated with bridge days. This may cause additional volatility in industrial production during months with bridge days. As Chart 3 shows, the monthly change in industrial production displays an additional volatility in the months with bridge days marked by vertical lines. Moreover, this volatility is on the downside in almost all months with bridge days and in some months, it can even exceed the one standard deviation range indicated by the horizontal dashed line. April, the first month of the second quarter, has a similar outlook. In the second quarter of the year, which included two months with bridge days, industrial production followed a highly volatile course[3] and contracted by 3.9% quarter-on-quarter.
Against this backdrop, in line with earlier studies on the issue[4], we recalculated the impact of bridge days on industrial production[5] and found that a bridge day decreases industrial production by around 1.3% on a monthly basis. Accordingly, our calculations with various methods suggest that bridge days in the second quarter had a downward impact of 0.8 to 2.3 percentage points on the quarterly change in industrial production.
Our estimates, which takes into account the high correlation between industrial production and industrial value added as well as the weight of industrial value added in GDP, suggest that bridge days may pull quarterly GDP growth down by 0.15 to 0.45 percentage points through industrial production.[6] We would like to note that this downward effect, which started to be observed in the second quarter, may mechanically push industrial production and national income data upwards in the third quarter.
In sum, national income data for the first half of 2024 suggest that taking into account factors such as the brought-forward demand in the first quarter and bridge days in the second quarter, there is a moderate but gradually increasing decline in the underlying trend of economic activity due to the lagged effects of the monetary policy. Leading indicators and high-frequency data for the third quarter also suggest that the slowdown in domestic demand continues. Accordingly, we expect that the contribution of rebalancing in demand to the disinflation process will continue stronger.
[1] Earlier studies suggest that consumption and investment demand may be brought forward by expectations such as for an increase in costs, the exchange rate in particular, and relatively tighter future financial conditions, as well as by the deterioration in inflation expectations (Crump et al., 2022; Dräger and Nghiem, 2021; D’Acunto et al., 2019; Duca-Radu et al., 2021).
[2] In the chain index method, the sum of the contributions of GDP sub-items may not always equal the change in GDP for the relevant period.
[3] A 5% decline in April, a 1.8% increase in May, and a 2.1% decline in June.
[4] Bozok and Kanlı, 2013; Yüncüler, 2015; Yüncüler, 2024
[5] These calculations are based on the initial findings of the forthcoming study by Taşan (2024).
[6] The last five years’ (2019-2023) average of the weight of industrial value added in GDP is 19.8%.