Turkstat’s 2019 survey of household expenditures reveal the picture of an economy slowly sinking from Middle Income to Lower Income nations, as household have little to spare for health, education and entertainment. The stats reveal large income disparities, as well as explaining one of the man reason why Turkey can’t develop socially: Income barely cover basic necessities, leaving aide little for the proper education of siblings and personal enlightenment. With CPI rising to 12.6%, the situation is not expected to improve in 2020. In fact, the broadest measure of unemployment reached 24.3% in April-May survey, suggesting that even health spending and the cherished habit of sending kids to private schools for better education might be sacrificed.
Working for rent!
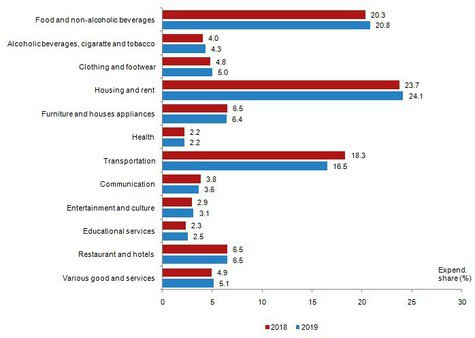
Housing and rent expenses took up the largest share of household consumption in 2019 with a rate of 24.1 percent, the Turkish Statistical Institute (TurkStat) announced today (July 16), according to an article by BiaNet.
Food and rent take up half the household budget
The share of expenditures on food and non-alcoholic beverages took second place with 20.8 percent and followed by transportation expenditures with 16.5 percent.
Compared to the previous year, housing and rent expenditures increased by 0.4 percent, food expenditures increased by 0.5 percent while transportation expenditures decreased by 1.8 percent.
The items that had the lowest shares in total expenditures were health with 2.2 percent, educational services expenditures with 2.5 percent and entertainment and culture expenditures with 3.1 percent.
The monthly average consumption expenditure per equivalent adult was estimated as 2,181 lira in 2018 and 2,465 lira in 2019 (1 TRY=6.86 USD)
The highest increase was in food and non-alcoholic beverages
According to the survey, the share of food and non-alcoholic beverages expenditures increased from 20.3 percent to 20.8 percent with 0.5 percentage points compared to the previous year. This increase is symptomatic of countries where real per capita GDP is declining, as well a manifestation of rampant food inflation.
The share of alcoholic beverages, cigarette and tobacco expenditures increased to 4.3 percent from 4.0 percent. The share of clothing and footwear was 5.0 percent in 2019, increasing from 4.8 percent in 2018. Regarding alcohol and tobacco, the jump in expenditures is a symptom of outrageous excise taxes, which is sapping purchasing power for other activities, as well as representing a significant transfer of income from household budgets to government coffers. As a result Turkey has one of the most active home distillery cottage industry in Balkans.
The share of housing and rent increased to 24.1 percent from 23.7 percent, entertainment and culture increased to 3.1 percent from 2.9 percent, educational services increased to 2.5 percent from 2.3 percent and various goods and services increased to 5.1 percent from 4.9 percent. The increases in entertainment culture and education services represent rising relative prices of these services, rather than changing consumer preferences.
On the other hand, the share of furniture and household goods decreased to 6.4 percent from 6.5 percent compared to the previous year. The share of transportation expenditures decreased to 16.5 percent from 18.3 percent with 1.8 percentage points and also the share of communication decreased to 3.6 percent from 3.8 percent.
The share of health expenditures and restaurant and hotel expenditures remained unchanged from 2018 to 2019 with 2.2 percent and 6.5 percent respectively.
And signs of further income disparity
When looking at the distribution of consumption expenditures by quintiles ordered by income in 2019, it was observed that the share of housing and rent was 31.2 percent, food and non-alcoholic beverages expenditures was 30.7 percent, transportation expenditures was 9.0 percent, furniture and houses appliances expenditures was 5.3 percent for households in the first quintile (the lowest quintile).
The share of housing and rent expenditures was 20.1 percent, transportation expenditures was 20.0 percent, food and non-alcoholic beverages was 15.3 percent and restaurant and hotels was 8.1 percent for households in the fifth quintile (the highest quintile).
You can follow our English language YouTube videos @ REAL TURKEY: https://www.youtube.com/channel/UCKpFJB4GFiNkhmpVZQ_d9Rg
And content at Twitter: @AtillaEng
Facebook: Real Turkey Channel: https://www.facebook.com/realturkeychannel/